
From Point Cloud to Digital Twin: What Makes Survey Data Useful Over Time?
Understand the steps between a point cloud, a BIM model and a digital twin, including purpose, asset data, updates, governance and Irish BIM requirements.
A dense point cloud can look convincing and still be wrong for the decision you need to make. Judge drone LiDAR by the delivered dataset, the independent checks and the tolerance your project requires.
5 MIN READ · Editorial date 16 July 2026
Reviewed 25 September 2026 · This edition includes later research.
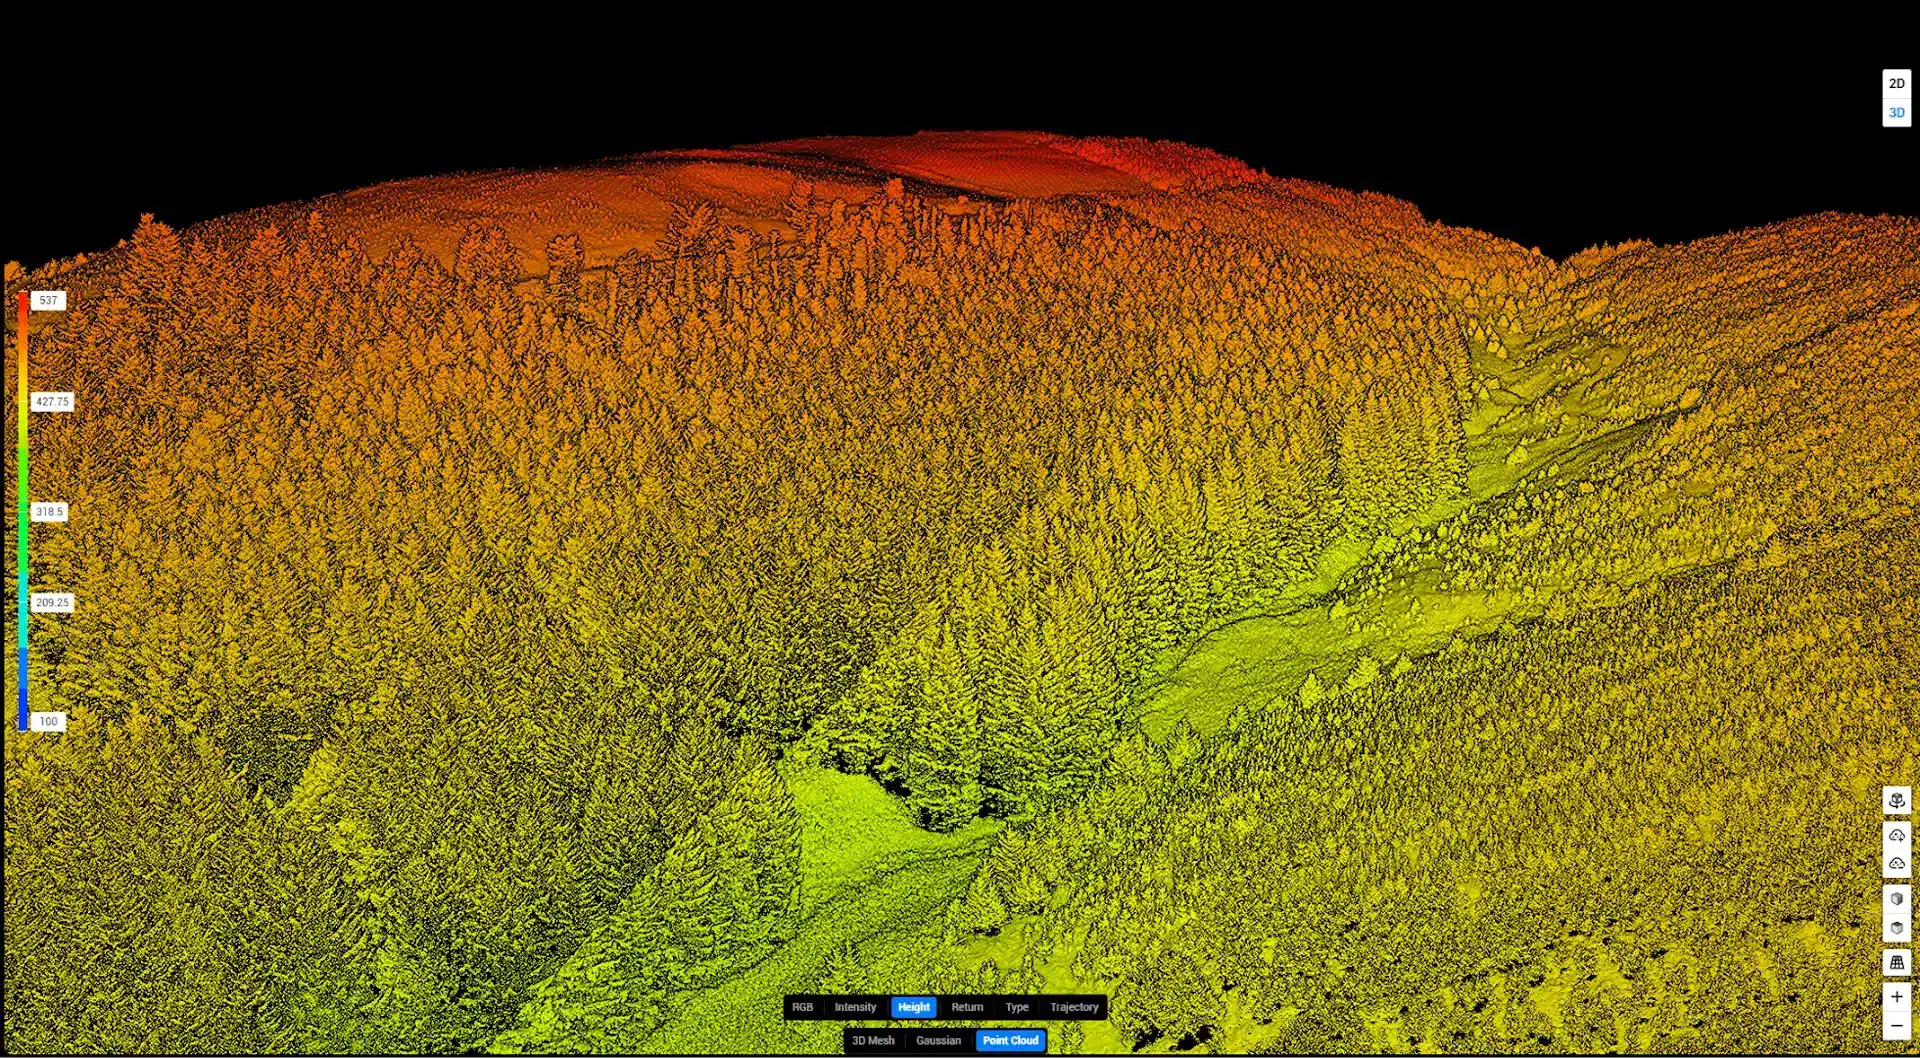
Sensor specifications are one part of an overall accuracy assessment.
Point density, precision and positional accuracy answer different questions.
Manufacturer specifications describe stated test conditions, not every site.
Agree acceptance criteria and independent checks before capture.
Absolute positional accuracy concerns how closely the delivered coordinates agree with an appropriate reference. Relative accuracy concerns how well features agree with one another within the dataset. Density describes the number and distribution of points. Improving one does not automatically improve the others.
A cloud can contain many points yet be offset from the project coordinate system. It can align well locally while different flight strips disagree. Or it can have strong overall positioning but too few ground observations beneath vegetation to model a small drainage feature reliably.
These differences matter because the intended decision changes the test. Broad terrain planning, a stockpile calculation and the setting-out of a structural connection do not share one universal accuracy requirement. Write the intended use into the brief before selecting the capture method.
DJI’s Zenmuse L2 specification gives system accuracy of 5 cm horizontally and 4 cm vertically at 150 m under stated conditions. Those conditions include RTK FIX, an IMU-calibration flight, a specified flight pattern and processing with accuracy optimisation.
The figure is a useful product reference, not a promise about an entire survey. The 150 m test height is also not permission to fly at that height on a particular Irish site. Aviation limits and survey performance are separate questions.
Ask the surveyor to explain the complete error budget: control, trajectory, alignment, measurement, classification and final modelling. A receiver-positioning figure describes one part of the system. It should not be substituted for the accuracy of the delivered point cloud or terrain model.
The ASPRS positional-accuracy standards provide a recognised framework for specifying and assessing geospatial data. If a contract adopts that framework, identify the edition and applicable requirements rather than quoting “ASPRS compliant” without a test plan.
Control points used to adjust a dataset are not equivalent to independent checkpoints used to test it. Agree the reference quality, distribution, sample size and reporting method. Checks should represent the areas and surfaces relevant to the intended use, not just the easiest patches of open ground.
Root-mean-square error can be useful, but it is not a complete description on its own. Ask for the number of checks, the residuals, any systematic bias, exclusions and the coordinate and height references. Avoid treating a small, convenient sample as proof of performance everywhere.
Which points were used for adjustment, and which were independent checks?
Do checks represent the site and intended use?
What reference system and height datum were used?
Are bias, outliers, exclusions and sample limitations reported?
LiDAR may obtain ground returns through gaps in vegetation, but it does not see through every canopy or solid obstruction. Dense vegetation, poor viewing geometry and limited access can leave gaps. Ground classification then requires judgement and checking.
A smooth terrain surface can hide those gaps because software interpolates between observations. Distinguish measured terrain from modelled terrain, and ask for low-confidence or unobserved areas to be identified. A surface that looks clean is not necessarily well supported.
For drainage or earthworks, breaklines and small features can be more consequential than average point density. A missed kerb, channel edge or retaining feature may distort a local design decision even when the general surface passes a broader accuracy test.
Drone LiDAR can be useful for terrain, corridors and volume work where coverage and access favour aerial capture. Photogrammetry may suit visible textured surfaces and image-rich outputs. Total stations, levelling and terrestrial scanning can provide complementary measurements where the task demands them.
None of those instruments guarantees a result merely by being named in a proposal. A ground instrument with a fine specification still depends on control, setup, observations and checks. Conversely, an aerial dataset can be entirely suitable when its demonstrated performance matches the brief.
A combined approach often makes sense: aerial coverage for the broader area, targeted ground observations at critical interfaces and a single coordinated delivery. The extra method is justified by the decision it supports, rather than by a desire to use every available technology.
Agree the required horizontal and vertical performance, the surfaces to be tested and the deliverables to be accepted. Include the terrain model as well as the point cloud if both will be used. State whether vegetation classification, breaklines, voids and feature extraction form part of the scope.
For repeat surveys, consistency also matters. A volume difference can reflect a real site change, a shifted datum, changed coverage or a different surface interpretation. Comparable capture and processing methods make the result easier to interpret, but independent checks remain necessary.
A useful handover includes a concise accuracy statement, coordinate information, capture date, check results and known limitations. It should help the designer decide where the dataset is suitable and where additional measurements are needed. That is more valuable than an unexplained centimetre claim on a cover page.
Start with the project tolerance, agree how it will be checked and judge the delivered data against that agreement. A clear acceptance process turns an impressive point cloud into usable survey evidence.
Sources checked on 25 September 2026. Current guidance and policy updates belong to this reviewed edition, rather than the earlier assigned editorial date.
Manufacturer performance figures with stated test conditions; not a guarantee of any delivered survey.
Framework and addenda for specifying and assessing positional accuracy.


2 Bridge St, Athlone, Co. Westmeath, N37 F1W4
+353 (090) 640 3114
info@utilistics.ie
Mo - Fri : 08:00am - 17:30pm
Sat : 09:00am - 14:00pm